
Google Lighthouse is an open-source tool developed by Google that provides an assessment of a web page’s quality. It generates scores across four categories: Performance, Accessibility, Best Practices, and SEO (Search Engine Optimization). Here is an absolute beginner’s guide to get you going.
Let’s breakdown the 4 things Google Lighthouse measures
- Performance basically measures “speed”. Specifically, it measures how quickly the elements on your webpage load, and how smooth the user interaction is. The higher the score, the better the performance. Factors that can influence this score include the time taken for the first contentful paint, speed index, largest contentful paint, time to interactive, total blocking time, and cumulative layout shift.
- Accessibility focuses on how well your website is designed for users with disabilities. A high score in accessibility means your site is user-friendly for all, taking into account elements like color contrasts, labels on forms, and correct usage of ARIA roles and properties.
- Best Practices evaluate whether your website is using modern web development standards. This involves checks for HTTPS usage, correct image aspect ratios, and validation of outgoing links, among others.
- SEO score measures how well your website is optimized for search engines. SEO is all about making your website discoverable to users. Factors include proper usage of meta tags, successful HTTP status codes, and the legibility of the font sizes.
Understanding these scores is crucial because it helps you identify and rectify potential issues on your website. Each Lighthouse audit provides additional information about why each factor is important and how to improve upon it. Remember, a score of 100 in each category is considered ideal, but a score above 90 is generally perceived as passing.
Understanding the report
Understanding the Google Lighthouse report is essential for optimizing your webpage and creating a better user experience. When Lighthouse finishes running its audits, it presents a report containing several key components.
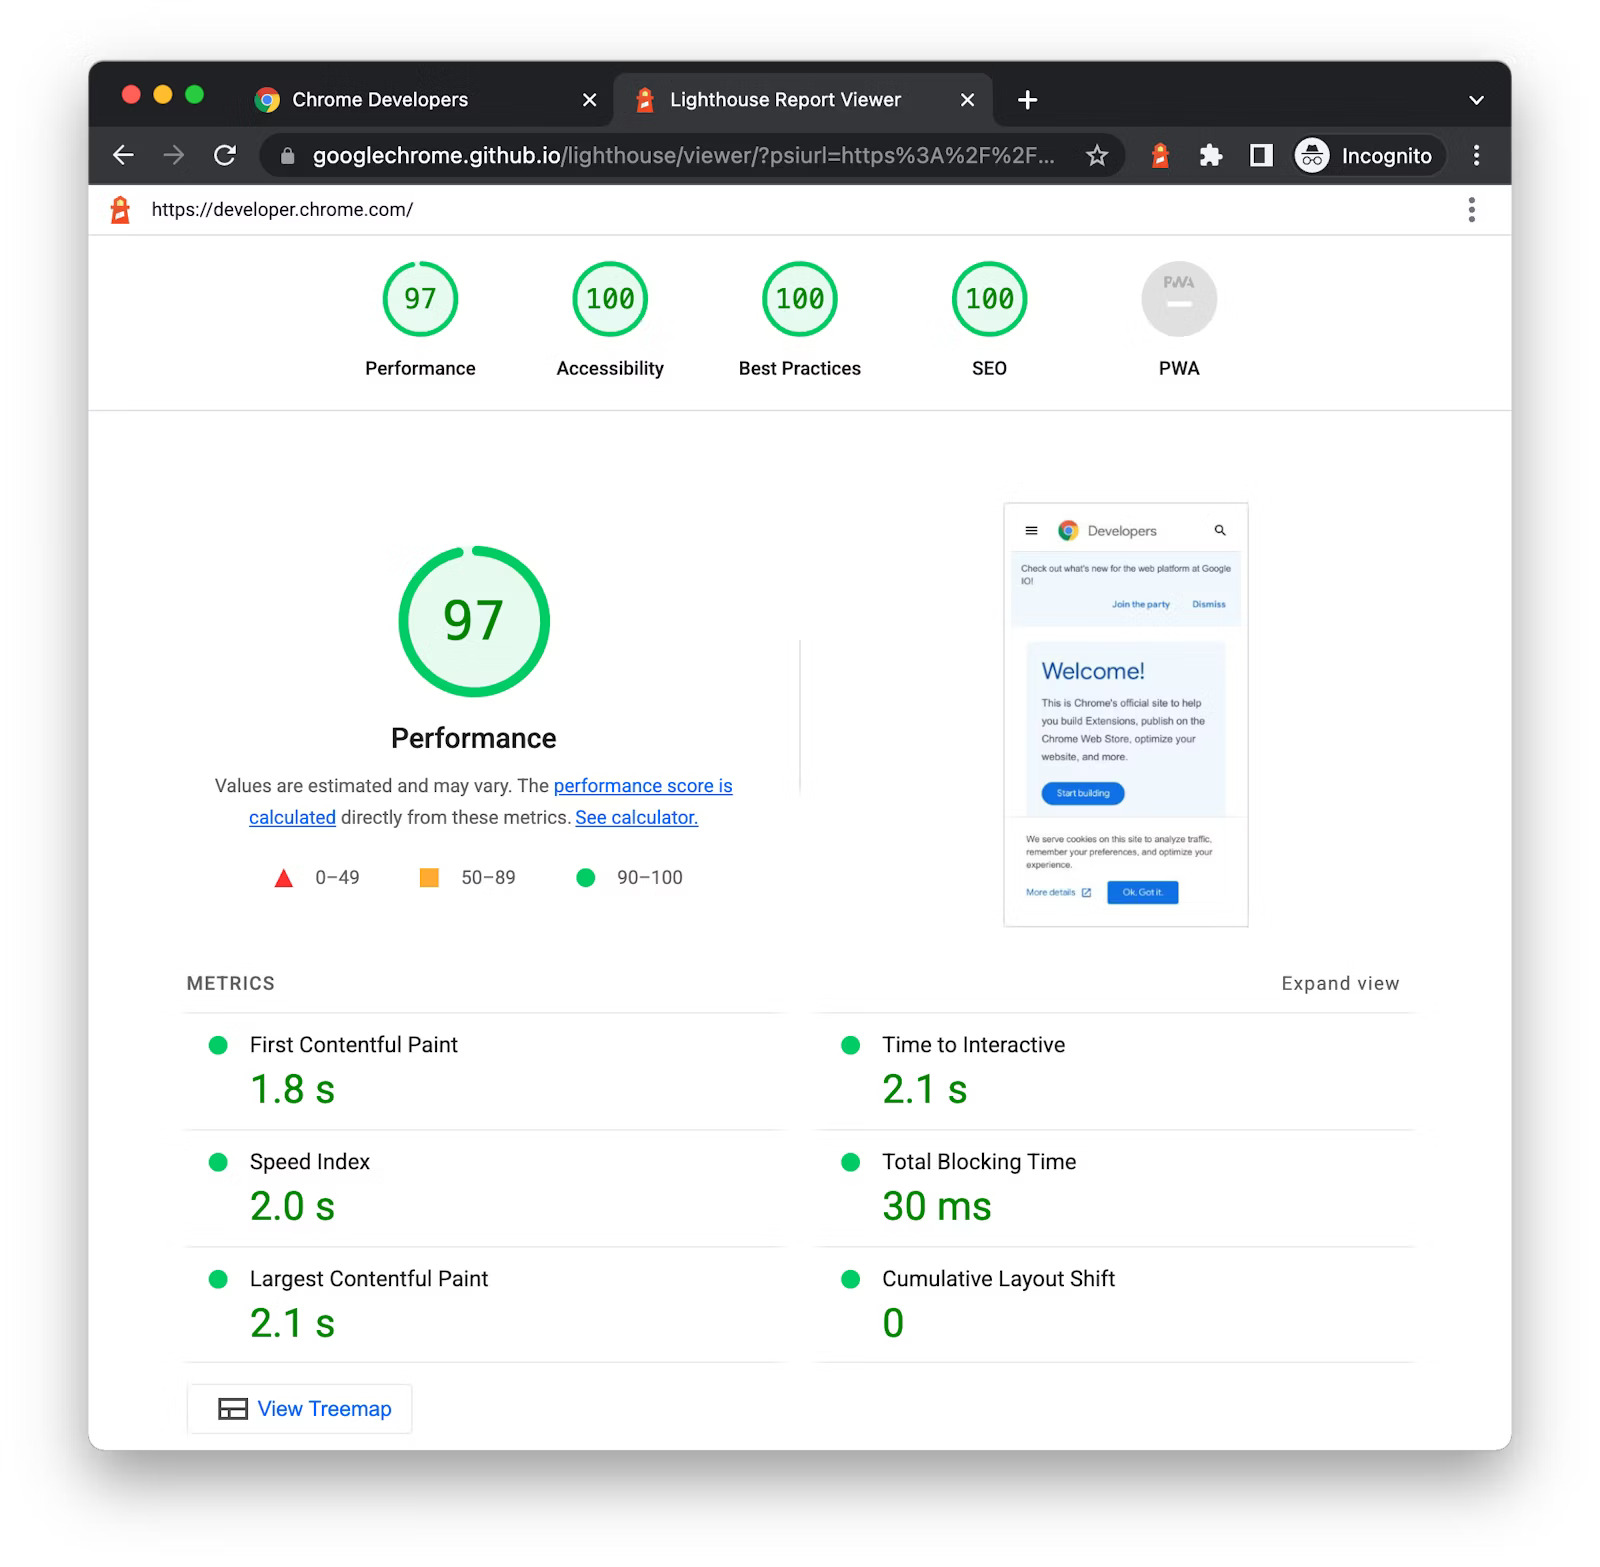
The report begins with an overall score for four categories: Performance, Accessibility, Best Practices, and SEO. These scores range from 0 to 100, with a higher score indicating a better optimized webpage. The colors red (0-49), orange (50-89), and green (90-100) provide a quick visual cue of your webpage’s status in each category.
The Performance section of the report provides insights into how fast your webpage loads and becomes interactive. Key metrics include First Contentful Paint (FCP), which measures the time from navigation to the time when the browser renders the first bit of content from the DOM, and Time to Interactive (TTI), which measures how long it takes for the page to become fully interactive.
The Accessibility section evaluates how accessible your webpage is to all users, including those with disabilities. It checks things like color contrast, use of ARIA roles and properties, and correct heading structure. Issues are flagged with descriptions and links to further reading to help you rectify them.
Best Practices reviews the use of modern web development standards. This can include checks for HTTPS usage, correct image aspect ratios, and whether all links have descriptive text. SEO, on the other hand, assesses whether your webpage is optimized for search engine results. It checks for successful HTTP status code, valid hreflang, and correct use of meta tags among other things.
Each audit in the report also has an associated “Learn More” link that leads to a page with detailed explanations about why the audit is important and how to fix any issues that were found. The report also contains a list of “Passed Audits” and “Not Applicable Audits” that indicate areas where your website is performing well.
The magic number: 90
Google Lighthouse will give you all sorts of information about the 4 different metrics it measures, but the thing you need to remember most is that you want to be scoring at least a 90 on all of them. If your page scores below a 90, you should look into improving the webpage.
If you are below an 80, then you really should take a beat and fix things.
Use PageSpeed Insights to run Lighthouse
Google PageSpeed Insights is a convenient online tool that uses Google Lighthouse to analyze the content of a webpage and generate suggestions to make that page faster. This tool is especially useful for those who wish to run a Lighthouse audit without having to use the Google Chrome browser or the command-line interface.
Using Google PageSpeed Insights is incredibly simple. You start by visiting the PageSpeed Insights webpage. Once there, you’ll find a field where you can enter the URL of the webpage you want to analyze. After entering the URL, click on the ‘Analyze’ button. The tool will then fetch the page, run the Lighthouse audit, and present you with a detailed report in a matter of seconds.
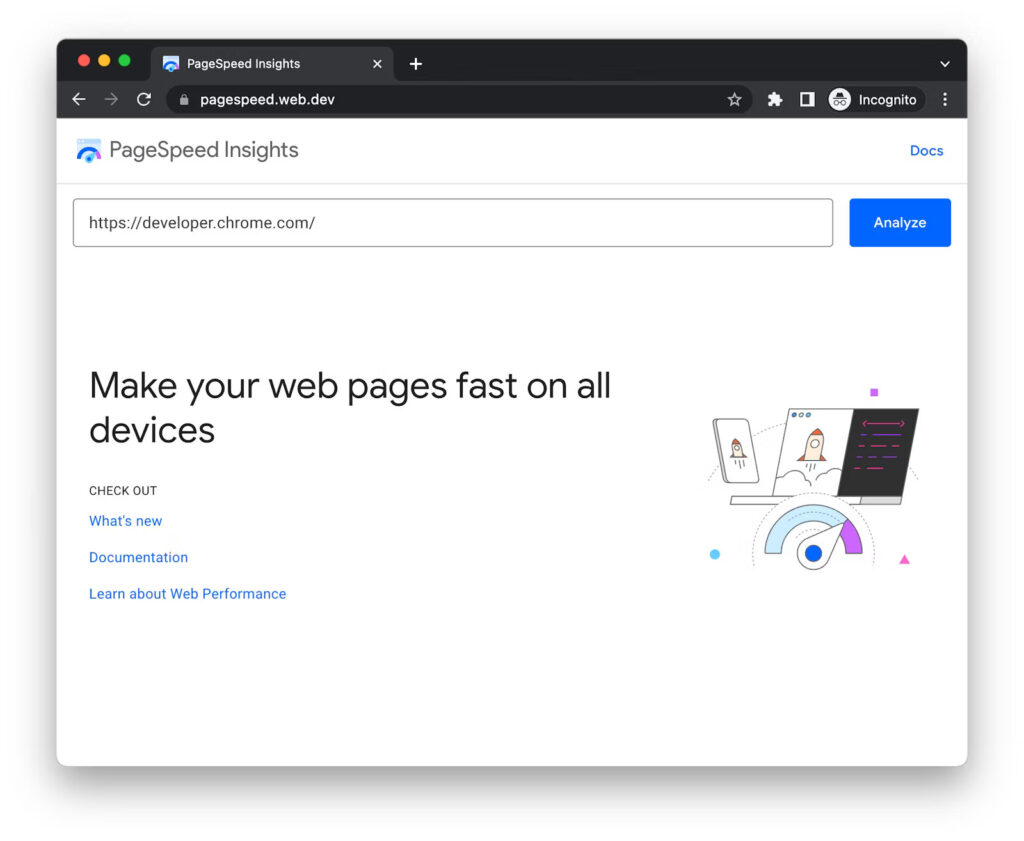
The generated report provides a wealth of information, including the Lighthouse scores for Performance, Accessibility, Best Practices, and SEO. For the Performance category, you’ll also get a detailed breakdown of several key metrics like First Contentful Paint and Time to Interactive, along with opportunities and diagnostics for improving the page’s performance. This makes Google PageSpeed Insights a highly effective tool for quickly gauging the quality of your webpage and identifying areas for improvement.
Run a report in Google Chrome (the developer way)
Chrome gives you the ability to run Google Lighthouse right in the browser, itself. Here’s how to do it:
First, navigate to the webpage you want to audit. Once there, right-click anywhere on the page and select ‘Inspect’ from the dropdown menu. This will open Chrome’s Developer Tools. Alternatively, you can open the developer tools by using the keyboard shortcut ‘Ctrl+Shift+I’ (or ‘Command+Option+I’ on a Mac).
Once the developer tools are open, look at the top of the tool panel where you will find several tabs such as ‘Elements’, ‘Console’, ‘Sources’, etc. Look for the tab named ‘Lighthouse’. Click on this tab to open the Lighthouse interface.
Before you generate the report, Lighthouse allows you to select which categories you’d like to run audits for. The categories include Performance, Progressive Web App, Best Practices, Accessibility, and SEO. You can leave all categories selected or pick specific ones depending on your needs.
After choosing the categories, click on the ‘Generate report’ button. Lighthouse will then start auditing the webpage. This process may take a few minutes, during which Lighthouse will reload the webpage several times.
Once the audit is complete, Lighthouse will display a report right within the developer tools window. The report provides scores for each selected category, along with detailed insights and recommendations. You can also save the report for later reference or share it with others.
How the heck does it work this magic?
Lighthouse works by executing a series of audits against the page, each audit having a reference doc explaining why the audit is important and how to fix problems. For example, an audit could check if your webpage has a viewport meta tag to adapt to mobile screens, or if your page has accessible names for links and buttons. The overall performance score is the culmination of each individual audit score.
So, basically, it’s like a bot that scans your webpage and checks all sorts of small rules that help it understand if the page is built properly or not.
Learn more about how to use Google Lighthouse
Check out this great crash course video: